I created my own magic wand using an Adafruit BNO055 Accelerometer! I wonder if people will be able
to decipher what spells I cast? (Note: readings were done 10 times per second)
This weekend I played in KalmarCTF with Babbage Patch Kids. I saw this challenge in the misc category and immediately knew:

We are given a file kalmar-fun.txt consisting of acceleration vectors:
(0.91, 1.32, 0.67)
(0.88, 0.19, -0.2)
(0.42, 0.33, 0.5)
(0.72, 0.72, 0.08)
(0.3, 0.06, -0.26)
(0.38, 0.07, -0.34)
... (89 KB left)
The challenge description implies that the flag was essentially drawn in the air while holding the accelerometer. We of course want position data, so we'll have to double integrate.
Initial Attempt
Unfortunately, it would not be as simple as just double integrating. The below image is the result:
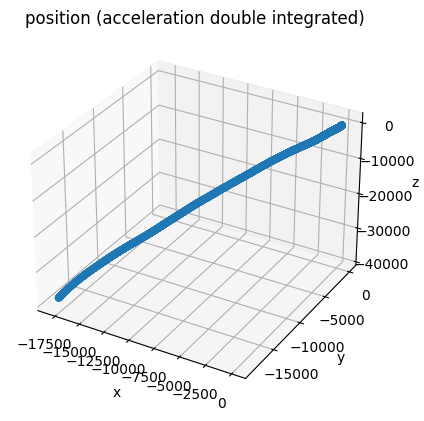
The position data explodes in basically a straight line. Below we see that the velocity also explodes.
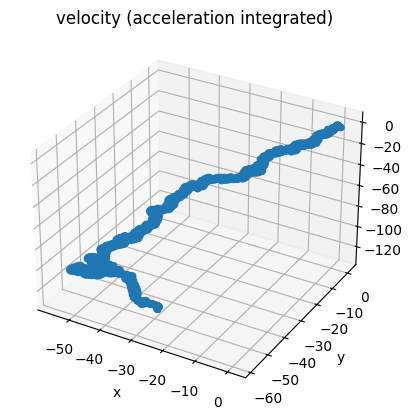
This must be a result of some minor steady-state error in the data that explodes over integration.
Fourier Analysis
We can perform some Fourier analysis to figure out what our problem is. We perform a 3-dimensional Fast Fourier Transform on our acceleration data. Below are the frequency magnitudes plotted.
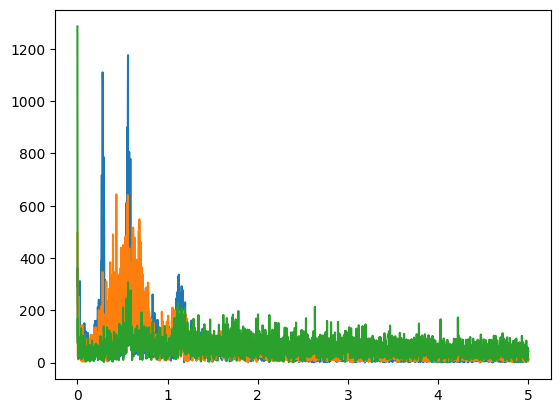
We have two primary spikes in this graph. The very sharp spike at the very beginning is quite suspicious though, as it's very low frequency data and there's not really any ramp up to that spike, indicating that perhaps it's noise and not real data. Let's try applying a high pass filter.
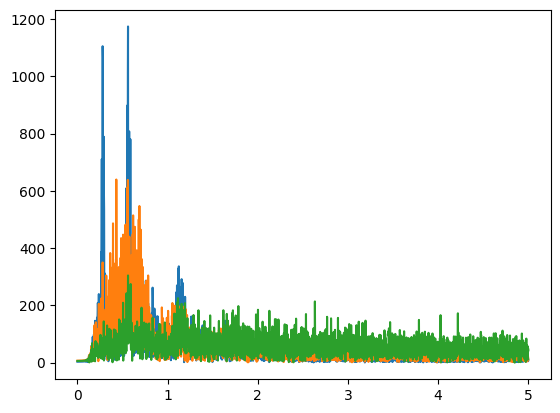
This is the result after applying a 5-dimensional butterworth high-pass filter with cutoff frequency 0.15Hz. It looks a lot better. Let's see the integration results on this data.
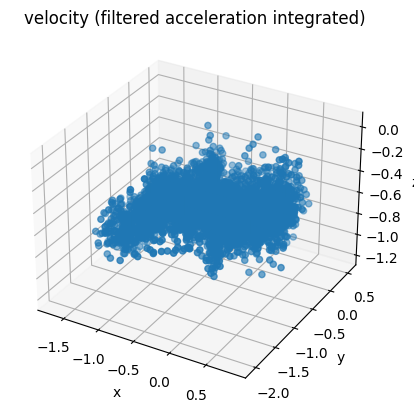
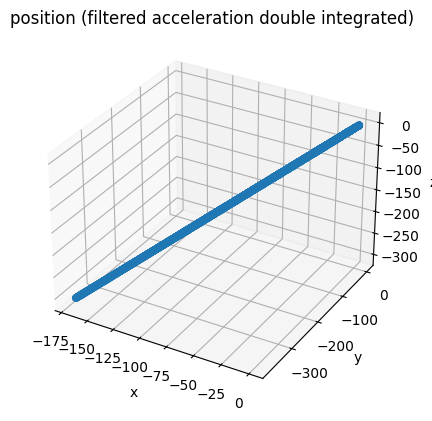
Interestingly, the velocity looks a lot better, but the position still explodes, albeit much less. Perhaps there's some noise in the velocity we can filter out after our first integration.
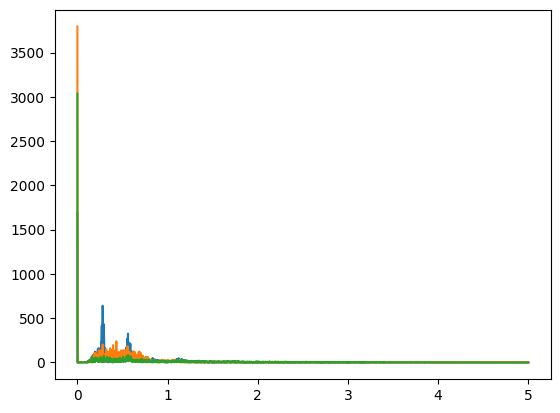
Yeah that's quite a pronounced spike. Let's get rid of that.
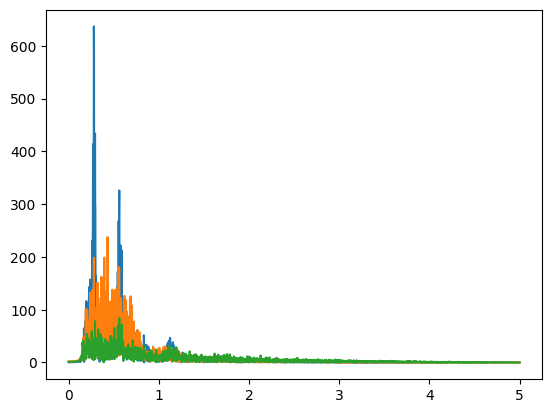
Much better. This is after applying the same 5-dimensional butterworth high-pass filter with cutoff frequency 0.15Hz. Now let's check out our position data with this velocity.
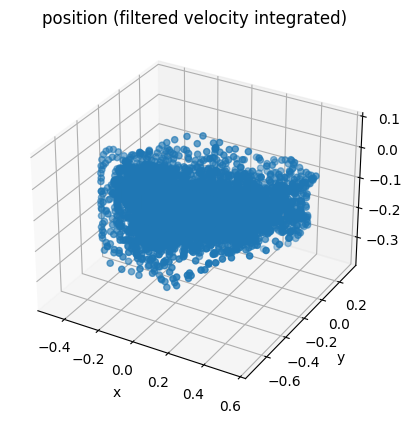
Looks pretty good but just to be sure, let's FFT this too.
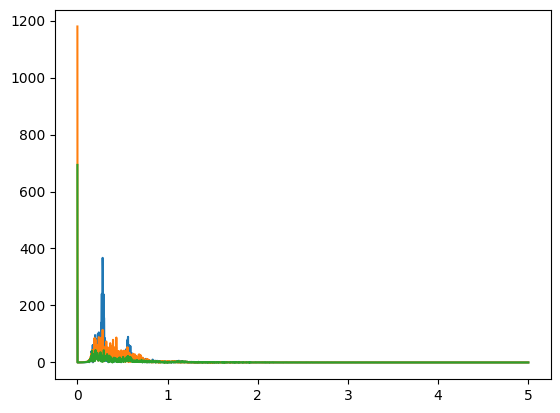
Good thing we checked. Let's just use the same filter and call it a day.
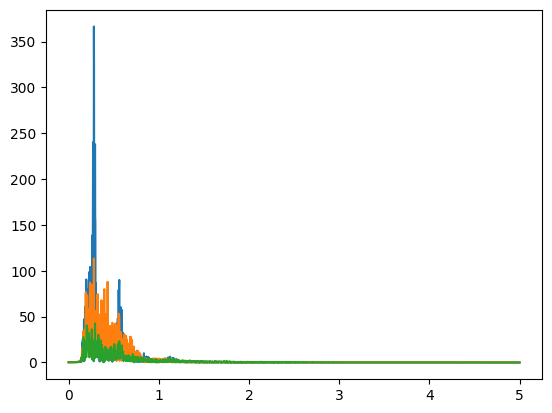
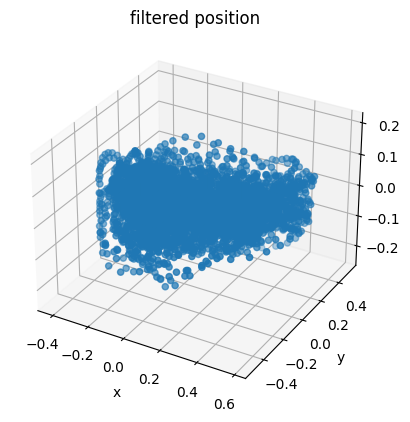
Incredible. The filtering script is below.
import numpy as np
from scipy import integrate, signal

with open("./kalmar-fun.txt", "r") as f:
    l = [[float(x) for x in s[1 : len(s) - 2].split(", ")] for s in f.readlines()]

ax = np.array([a[0] for a in l])
ay = np.array([a[1] for a in l])
az = np.array([a[2] for a in l])

# 5-dimensional butterworth high-pass filter with cutoff frequency 0.15Hz
sos = signal.butter(5, 0.15, btype="highpass", fs=10.0, output="sos")

# filter acceleration
fax = signal.sosfiltfilt(sos, ax)
fay = signal.sosfiltfilt(sos, ay)
faz = signal.sosfiltfilt(sos, az)

# integrate to get velocity
ivx = integrate.cumulative_trapezoid(fax, dx=0.1)
ivy = integrate.cumulative_trapezoid(fay, dx=0.1)
ivz = integrate.cumulative_trapezoid(faz, dx=0.1)

# filter velocity
ivx = signal.sosfiltfilt(sos, ivx)
ivy = signal.sosfiltfilt(sos, ivy)
ivz = signal.sosfiltfilt(sos, ivz)

# integrate to get position
ipx = integrate.cumulative_trapezoid(ivx, dx=0.1)
ipy = integrate.cumulative_trapezoid(ivy, dx=0.1)
ipz = integrate.cumulative_trapezoid(ivz, dx=0.1)

# filter position
fpx = signal.sosfiltfilt(sos, ipx)
fpy = signal.sosfiltfilt(sos, ipy)
fpz = signal.sosfiltfilt(sos, ipz)

fp = np.stack([fpx, fpy, fpz], axis=1)
with open("./filtered.txt", "w") as f:
    fp.tofile(f, sep="\n")
Visualization
Now, we're not really done. If we throw our points into Blender and make segments between them, we get this.
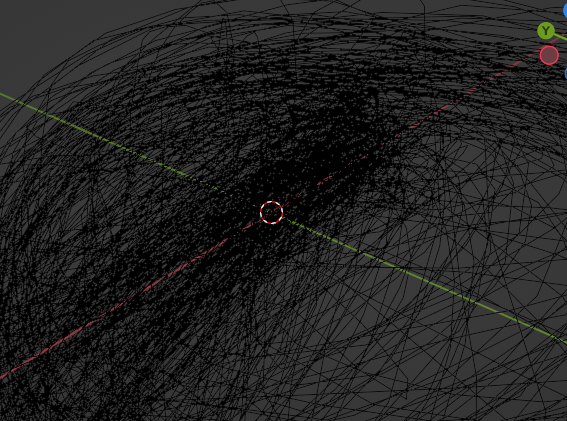
There are so many points that we can't actually see what's being drawn. It sure would be nice to have a visualizer for temporal 3-dimensional data. Well, due to my interest in graphics, I was quite eager to write one myself. I wrote it in C++ with OpenGL and it ended up being 550 lines of the worst code I have ever written, but I wrote it very quickly so you can't really blame me.
It features a persistence trail for visualizing movement, color based on distance for better readability, rewinding playback, clearing displayed paths, first-person camera movement, camera unit view hotkeys, camera zoom, camera rotation, and breakpoints in playback. The source is on GitHub here: https://github.com/segalll/vis.
Here is a video of the playback.
It appears that the word FLAG is drawn at the beginning, with everything after being a series of binary digits. The first binary digit is a 1, so we must have 7-bit ASCII. Transcribing, we get
1101011 1100001 1101100 1101101 1100001 1110010 1111011 1110011 1110100 1100101 1100001 1100100 1111001 1011111 1101000 1100001 1101110 1100100 1110011 1111101
which translates to kalmar{steady_hands}, our flag. And we got first blood out of 7 total solves.
I had a lot of fun with this challenge. I didn't exactly do it the intended way (intended was using a Kalman filter, ignoring the Z-axis, and segmenting the characters out individually), but we got there in the end.